Anika Raj

Hi, I’m Anika!

I’m interested in what data tells us, but even more in what it leaves out and the stories behind those numbers.

Through computer science, research, and the things I build, I want to understand these stories more accurately and translate complicated information into tools people can use to make decisions for themselves.

Explore my work A little about me
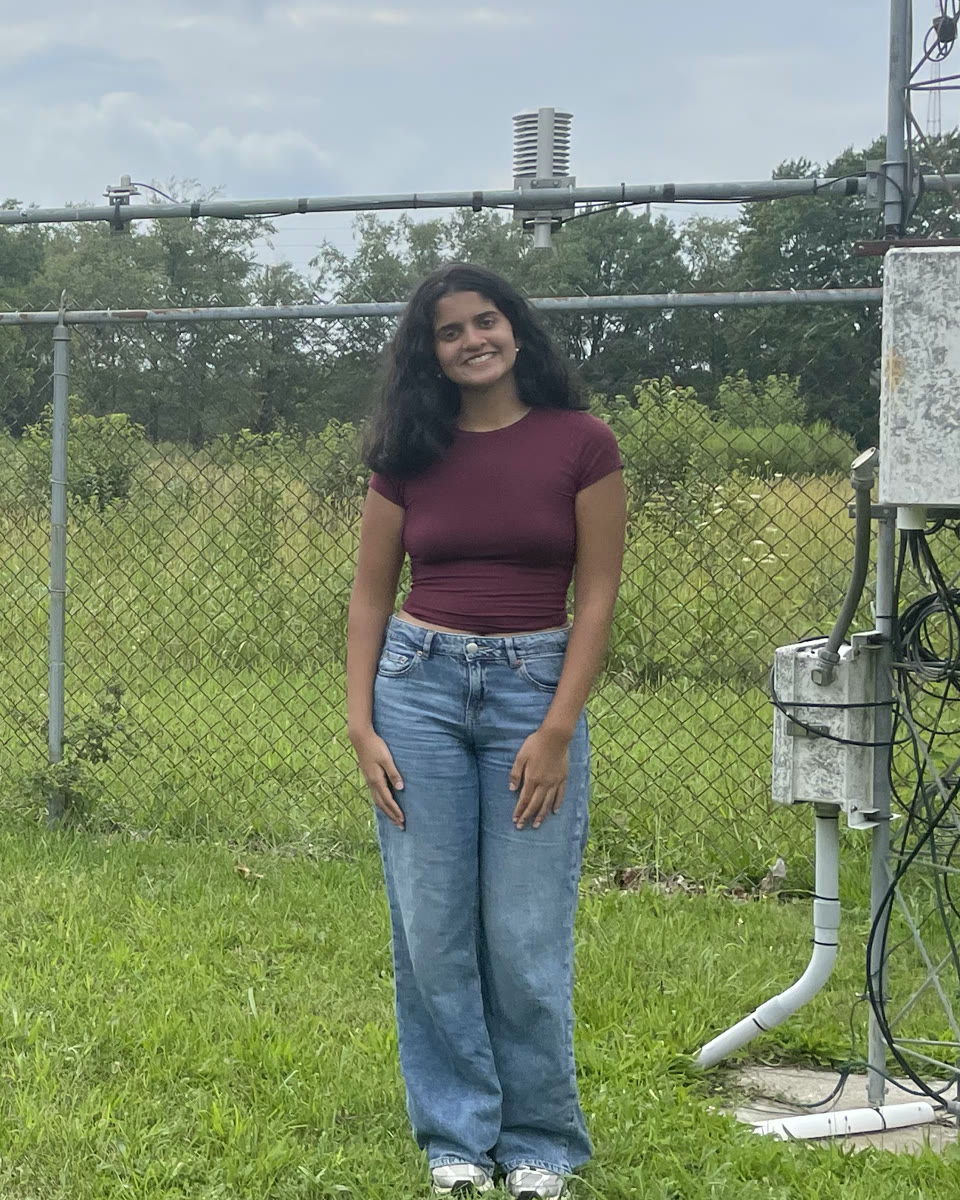
Anika smiling beside the instruments of an Illinois Climate Network weather station
Illinois Climate Network station, Aug 2026

one of the stations behind my drought research

Selected work

three projects, three questions

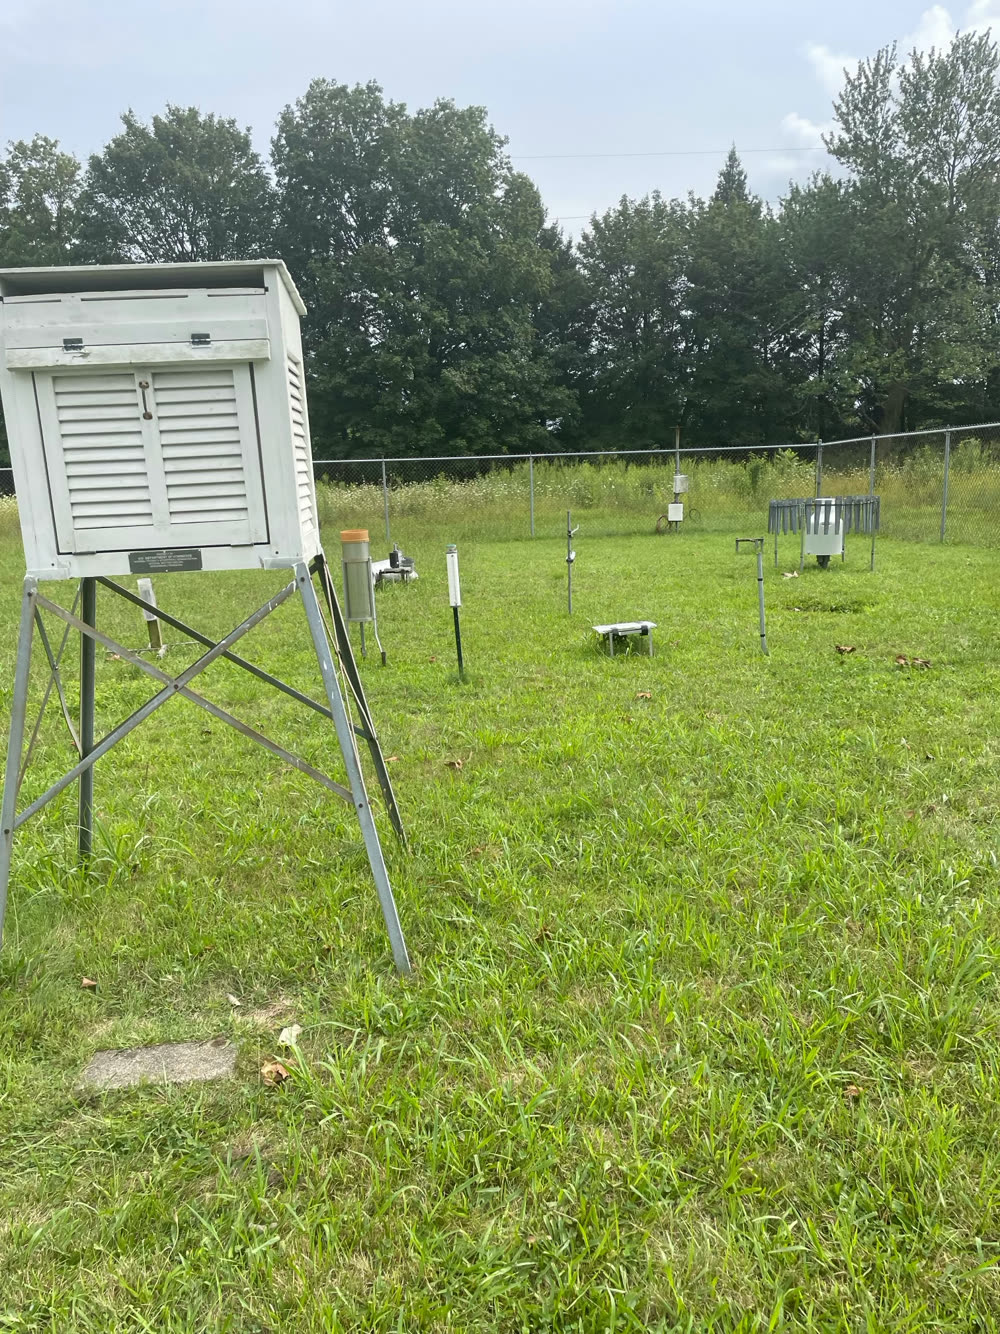
Instrument shelter and rain gauges inside a fenced Illinois Climate Network station FIG. 01

Machine-learning research · ISWS, UIUC

Predicting Drought Across Illinois

What happens when the overall error looks good, but nearby stations tell different stories?

With Dr. Allison Goodwell at the Illinois State Water Survey.

Explore the research
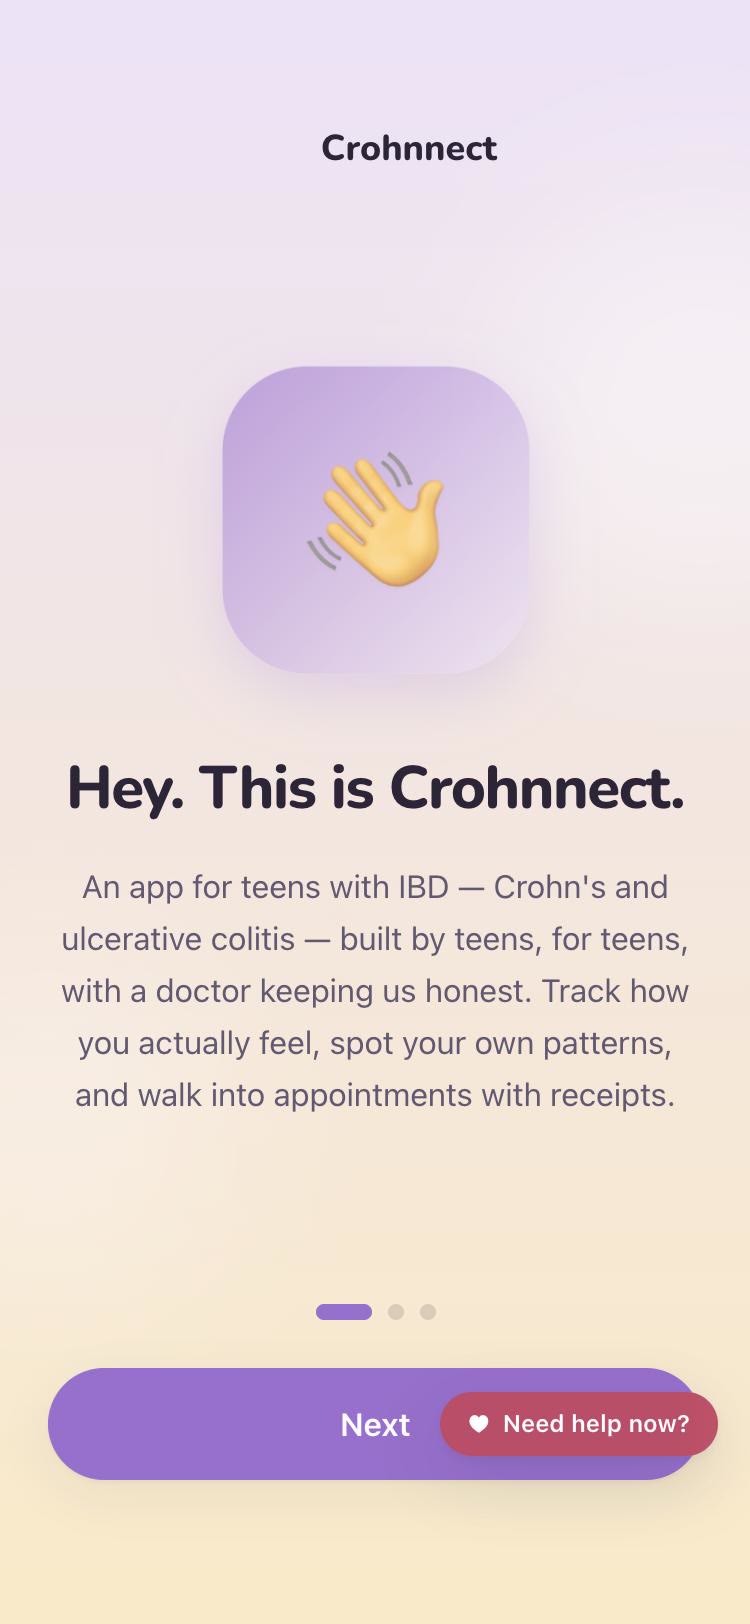
Crohnnect welcome screen: an app for teens with Crohn’s disease and ulcerative colitis
FIG. 02

Co-founder & developer · health tech

Crohnnect

An IBD companion shaped by the teens who use it.

Built with a co-founder who has IBD; physician advisor Dr. Jonathan Cordova, Lurie Children’s Hospital.

Watch the demo
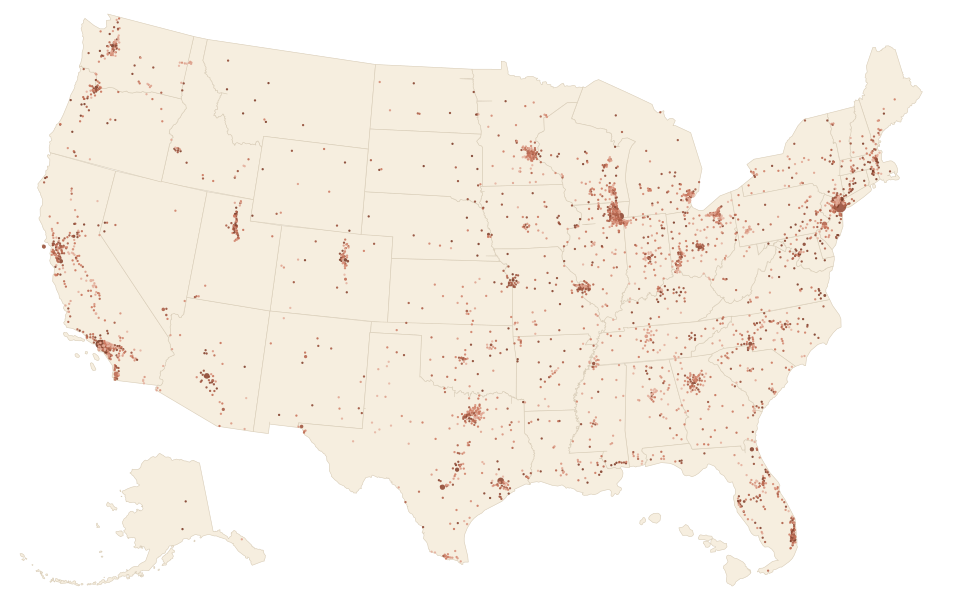
Map of the U.S. cities in the readiness study, each shown as a dot FIG. 03

one dot per city

Research & development · DPI

Understanding Urban Readiness

What goes into a city-level risk or preparedness comparison?

With Dr. Abhinav Wadhwa and Dr. Ashish Sharma at Discovery Partners Institute.

Explore the city map

A little about how I think

(usually with one more question)

I spend a lot of time going down research rabbit holes, questioning results, and figuring out how complex information connects to the people behind it. That might mean examining drought predictions station by station, exploring the assumptions behind a city ranking, or changing Crohnnect after conversations with teens and physicians. Outside coding, you’ll find me teaching Kathak, making art about cities and nature, or helping other students build ideas of their own.

Elsewhere in the notebook

movement, art, teaching, and one award

Kathak कथक
More than twelve years of training, Visharad certification in 2025, and 375+ hours of volunteer teaching; I now mentor seven Visharad-level students. The name comes from katha, “story”. The clip is a 31-second excerpt from a 2025 performance.
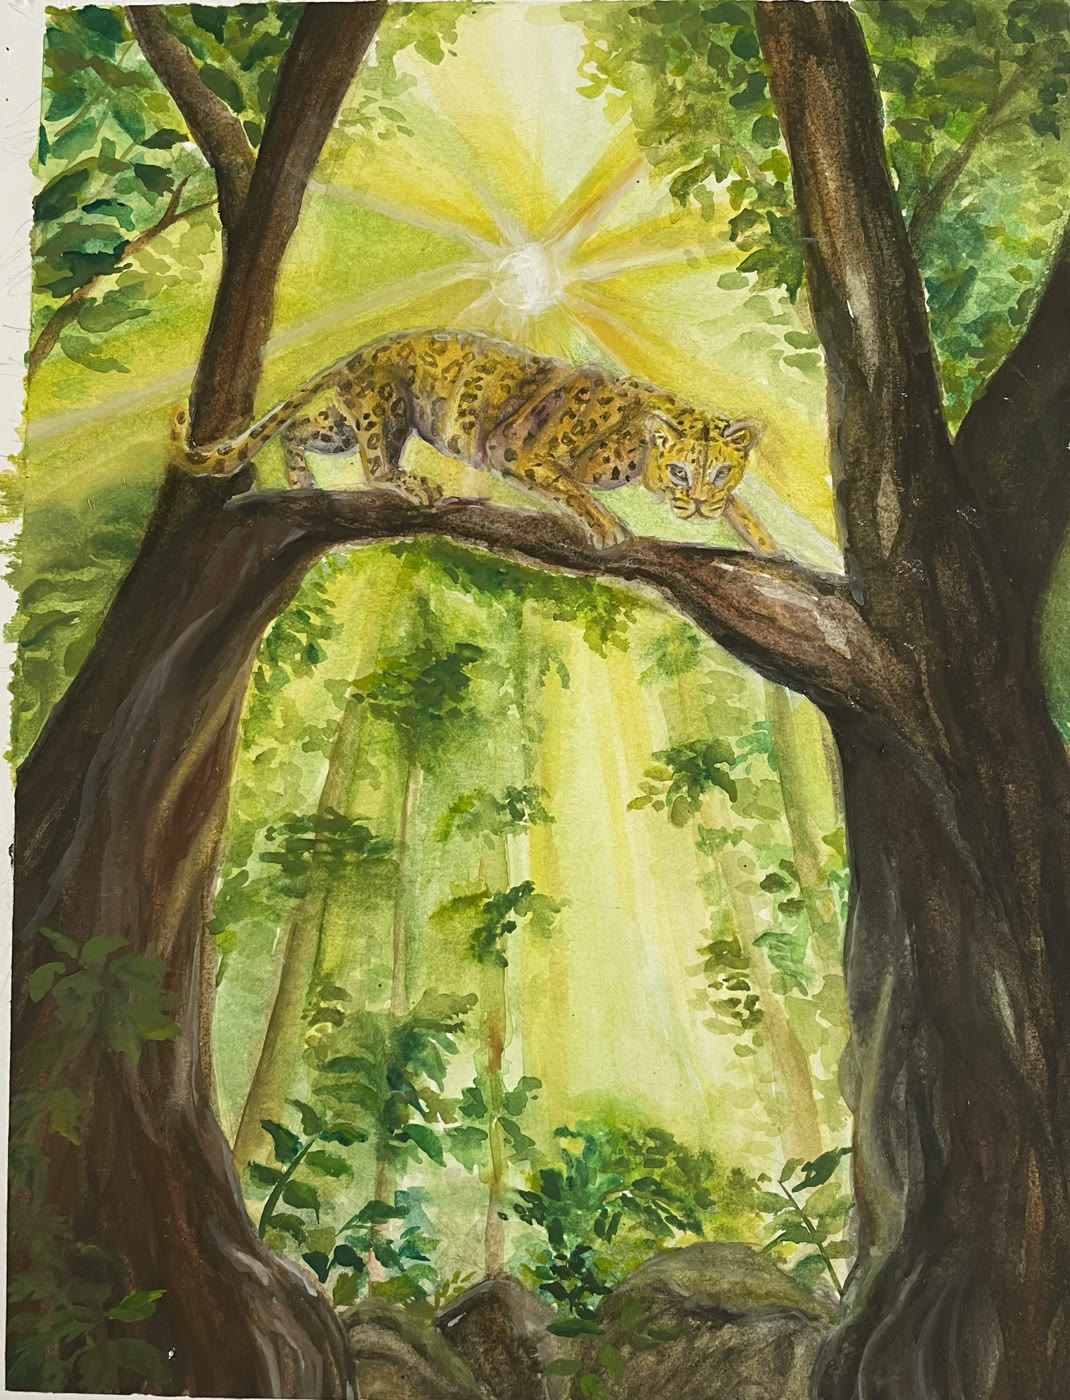
Watercolor of a leopard crouched on a branch in a sunlit forest
Cities, humans & nature AP Studio Art · the first piece in a series. more in progress
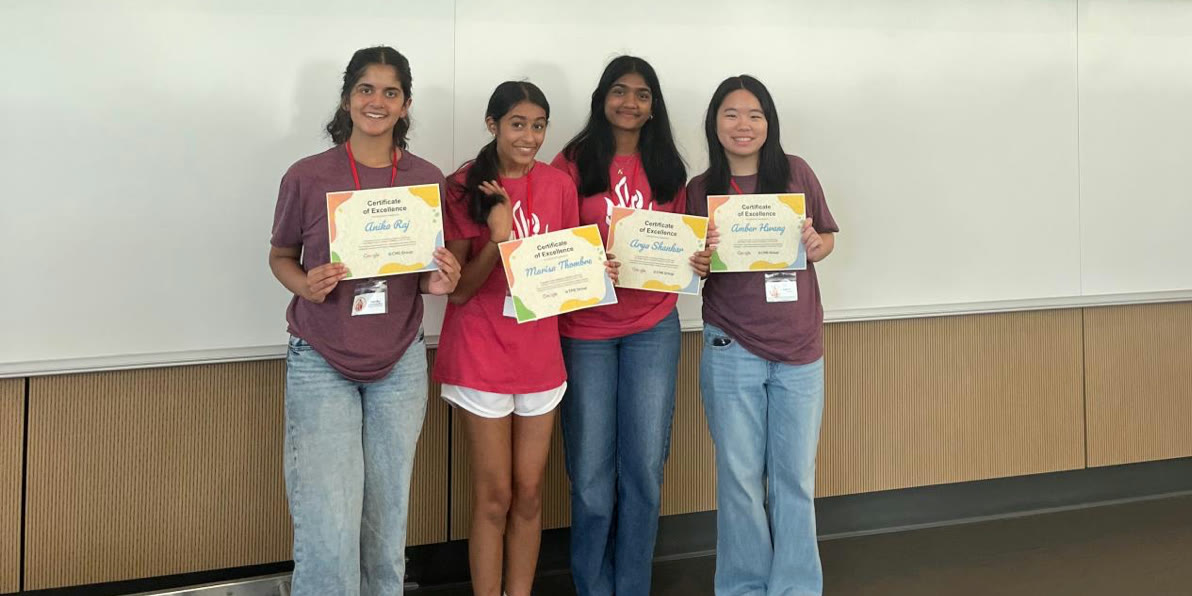
Anika and her three EyeAssist teammates holding certificates of excellence from the CME Group and Google Innovation Challenge
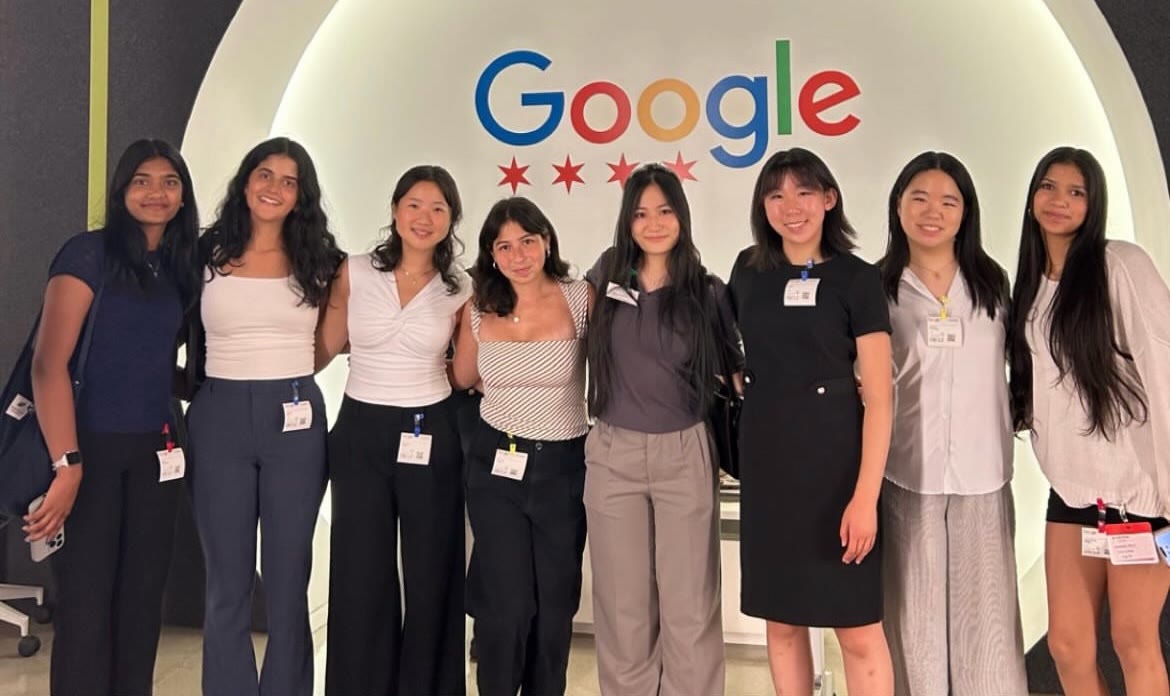
Group photo in front of the Google sign at Google’s Chicago office during the site visit
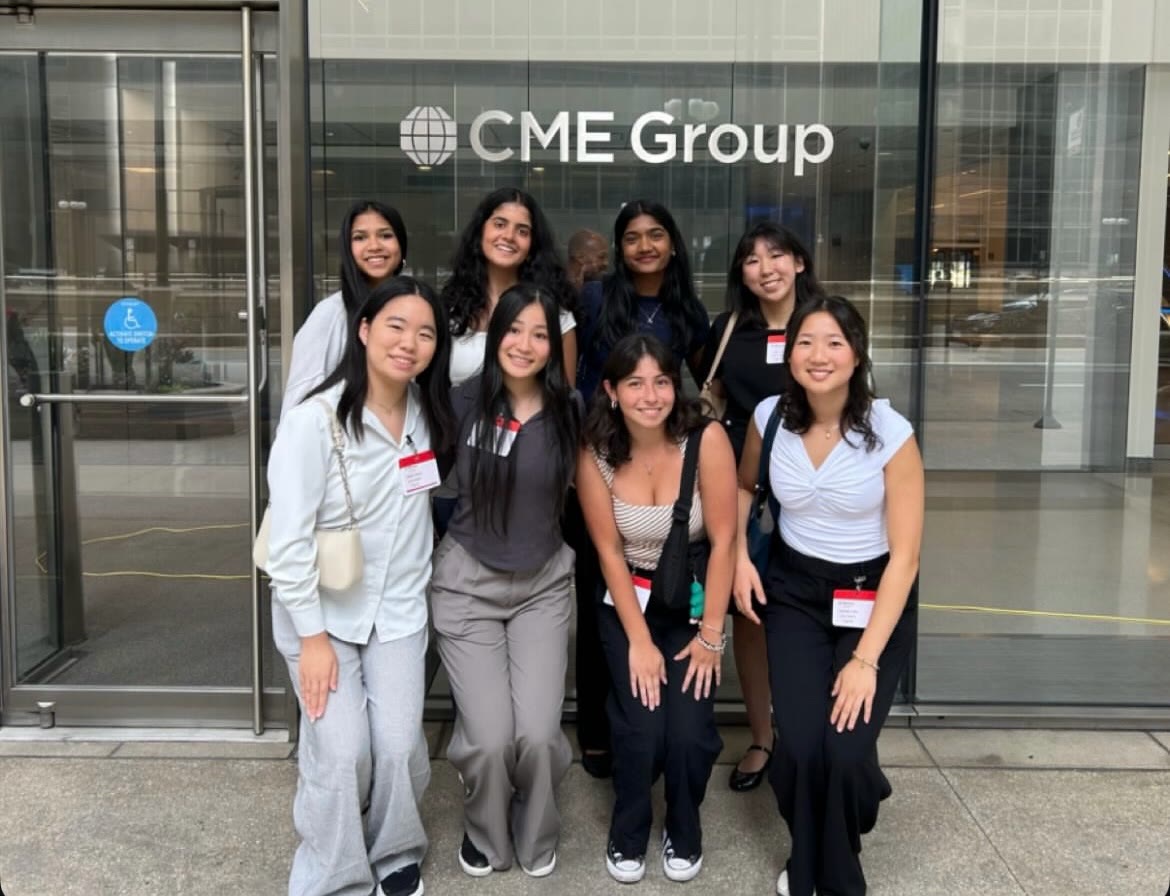
Group photo outside CME Group’s Chicago office during the site visit
EyeAssist · 1st place CME Group × Google Innovation Challenge, 2025. As project lead in a team of four, I designed the system: YOLOv11 computer vision, LiDAR depth sensing and PointNet 3D modelling turned into bone-conduction audio cues for people with visual impairments. Placing first earned us site visits to the CME Group and Google offices in Chicago. site-visit days at Google and CME Group
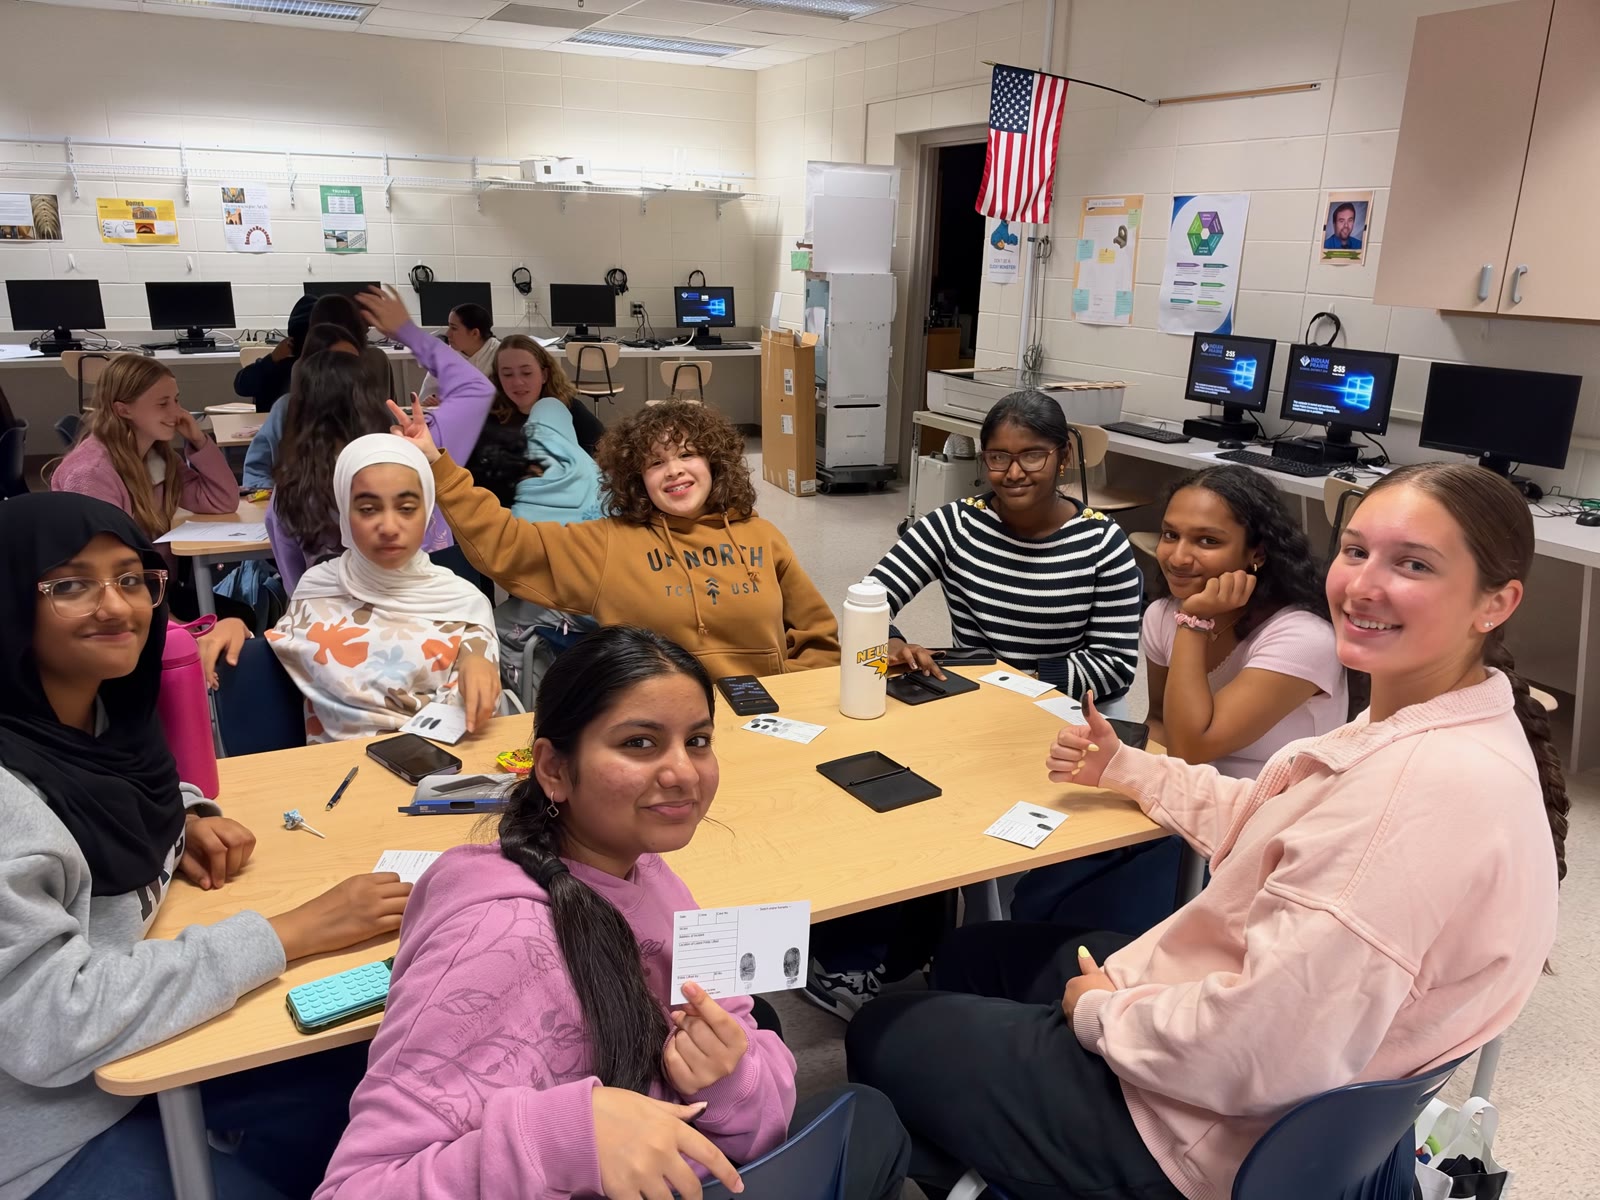
Students smiling around a table at a Girls in STEM workshop in a school computer lab
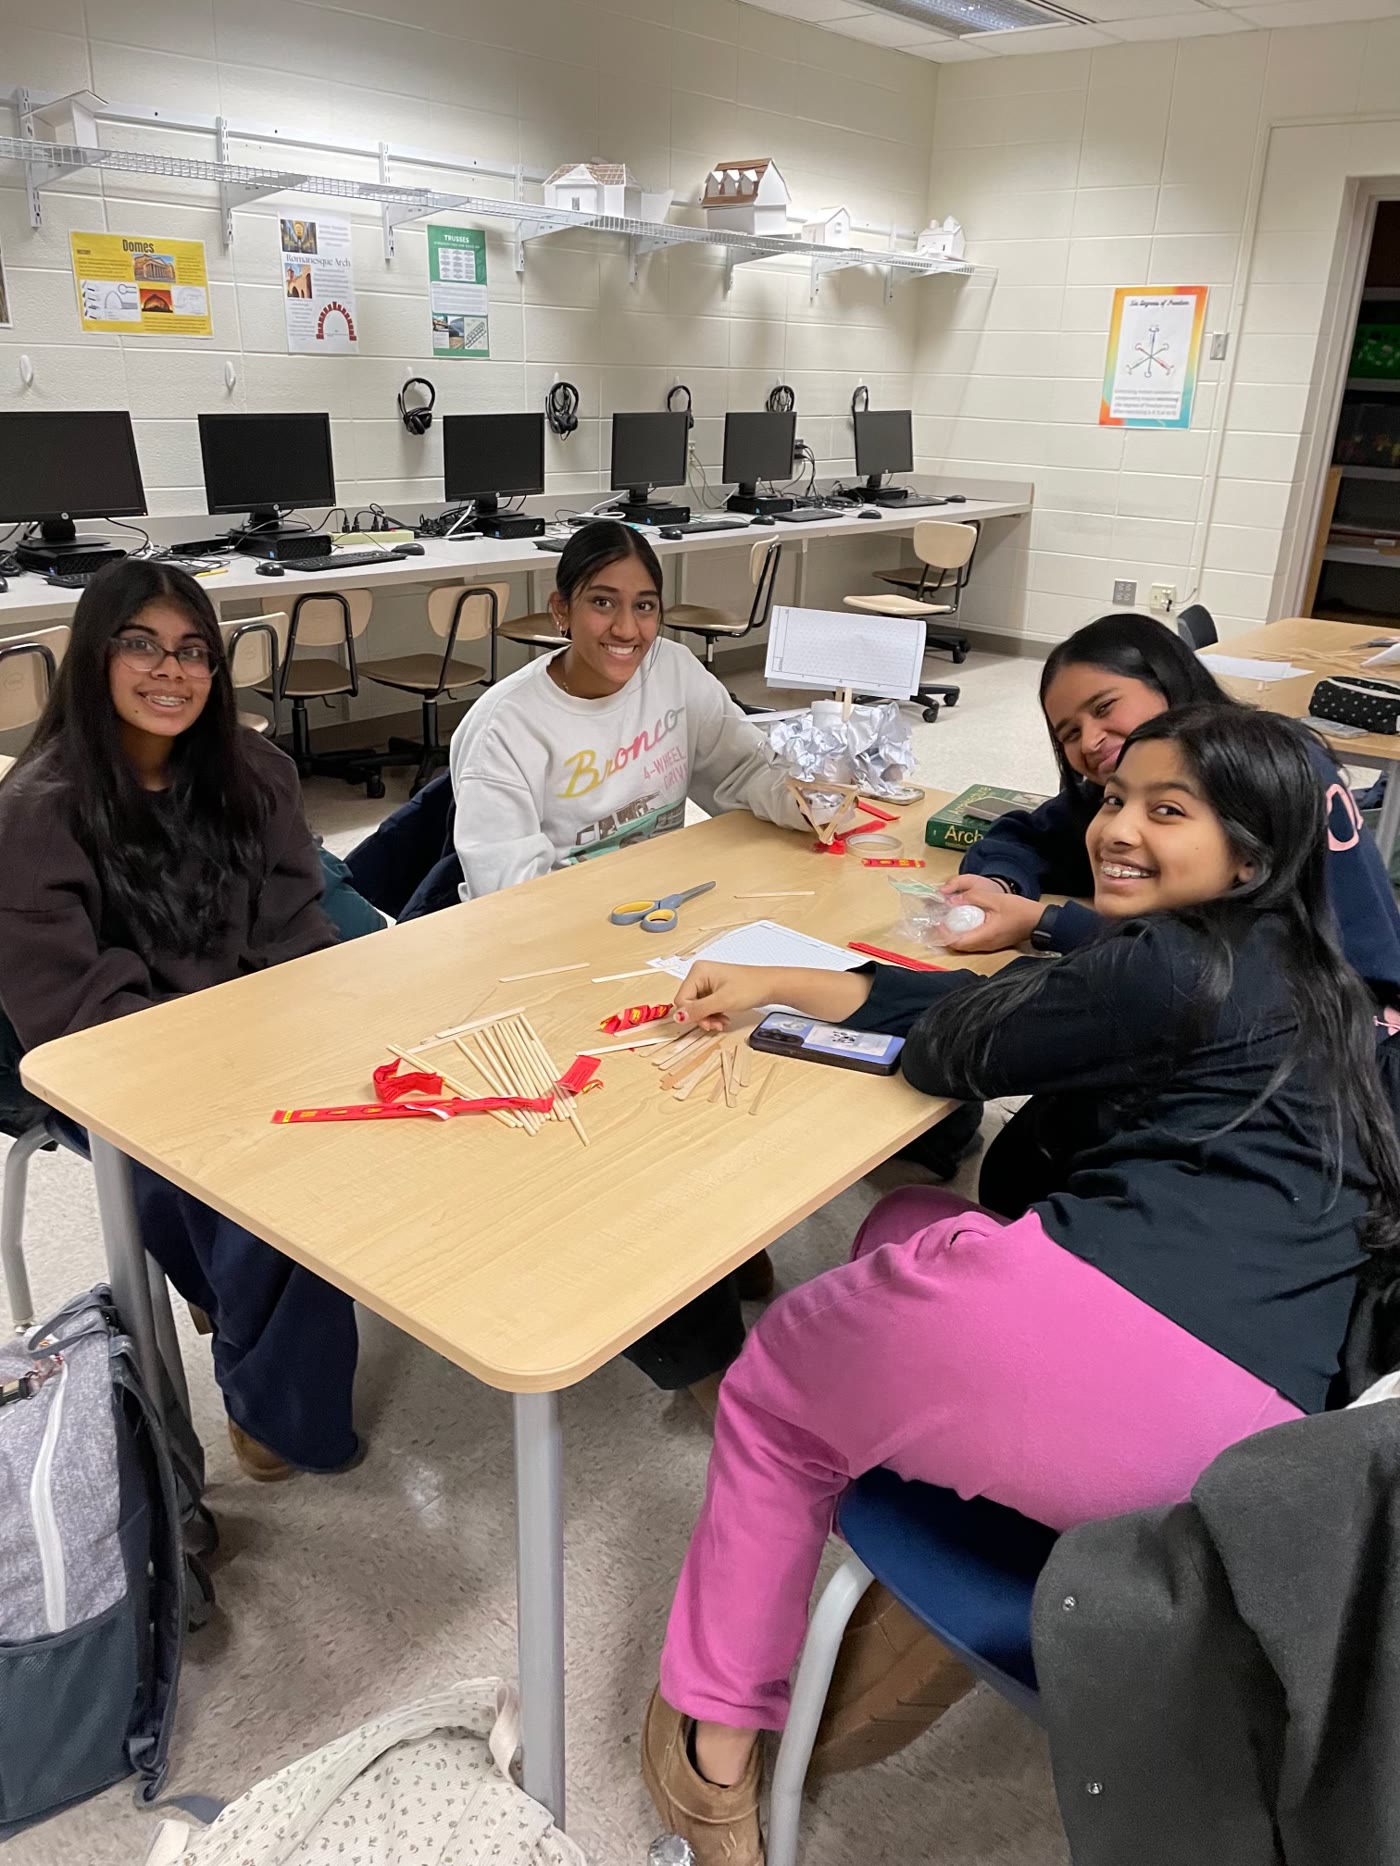
Four students building a structure from craft sticks and tape at a Girls in STEM meeting
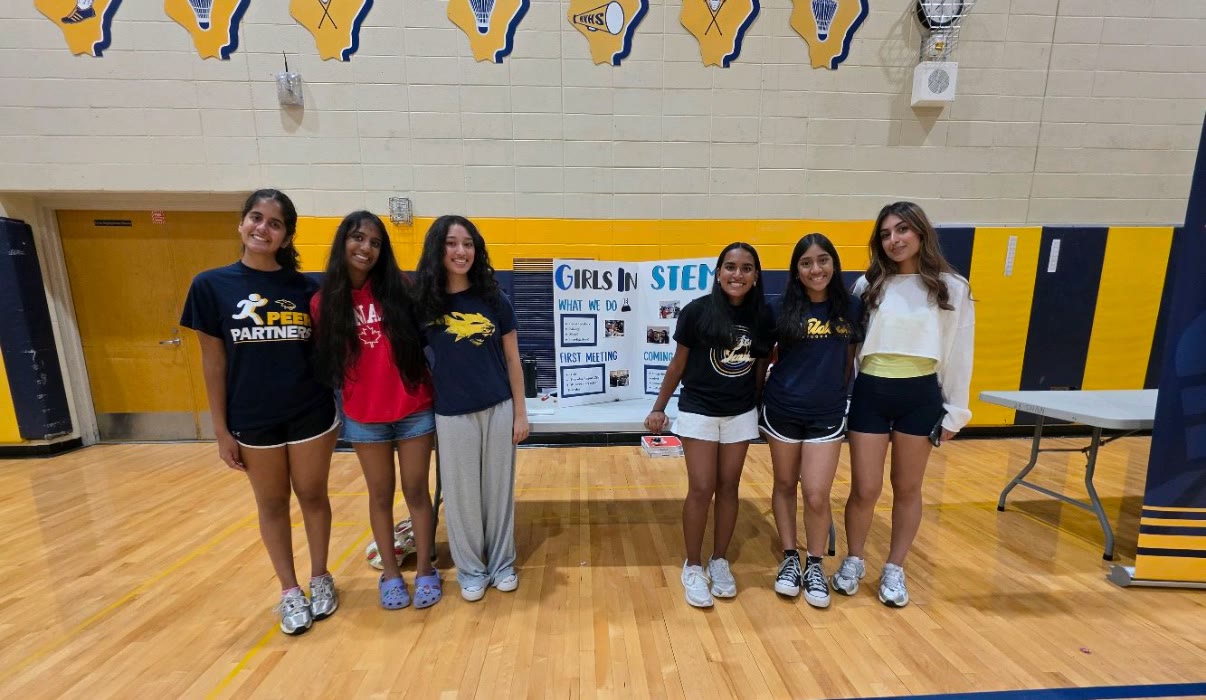
Six Girls in STEM members beside the club’s poster in the school gym
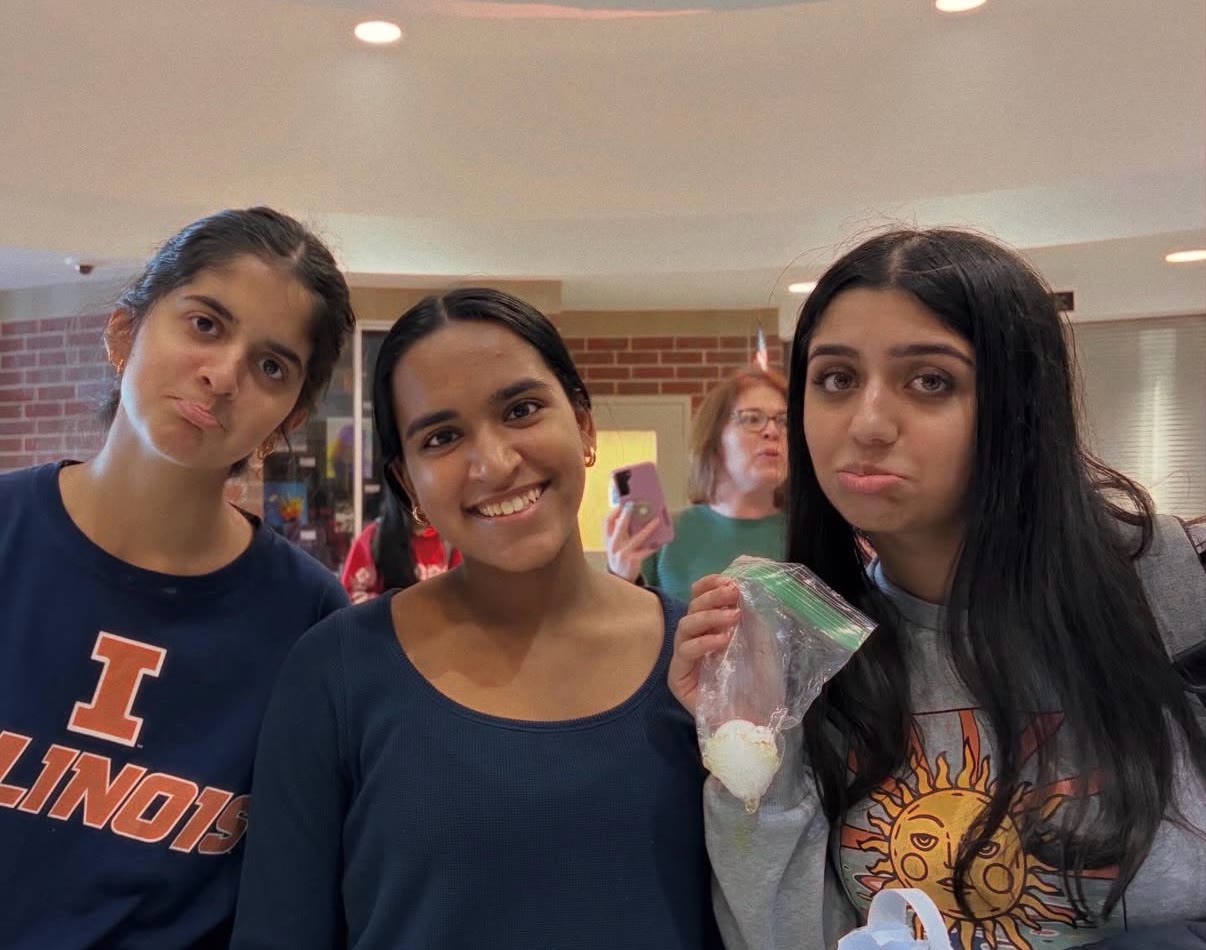
Three students holding up a bagged egg during a hands-on challenge
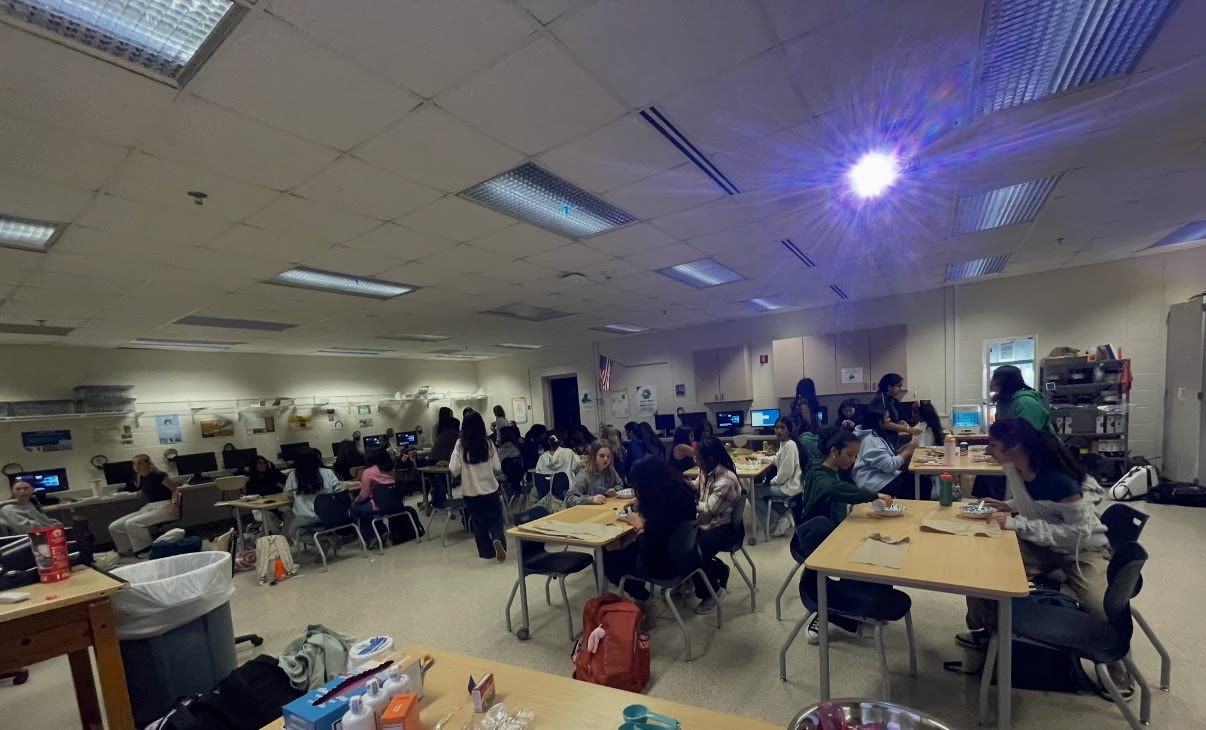
A classroom full of students working at tables during a Girls in STEM meeting
Teaching people to build Girls Who Code, Girls in STEM, and AI/game-making camps: helping students turn a new concept into something they can build themselves. In Girls in STEM I design and lead hands-on workshops for 20–25 students per meeting, and our Girls Who Code chapter grew from four to 15+ members. a few Girls in STEM meetings

A few milestones